Hockey Maps - NCAA Hockey
Hockey Maps - NCAA Hockey


A state by state breakdown of NCAA Division I, II and III programs across the United States.
NCAA Division I
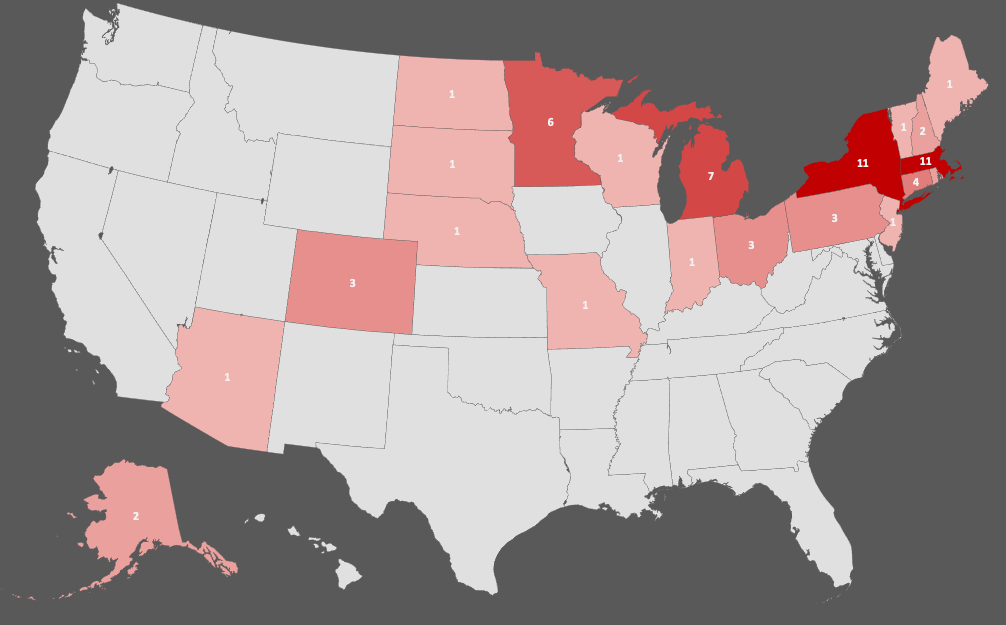
Division I stretches across the northeast and midwestern states, with independent programs in Arizona (Arizona State), and Alaska (Anchorage, Fairbanks) after the WHCA reformed into the CCHA. Hockey East , Atlantic Hockey and the ECAC make up the New England, and tri-state area programs, with New York and Massachusetts leading all states with 11 total programs.
Most Programs By State
New York - 11
Massachusetts - 11
Michigan - 7
Minnesota - 6
Connecticut - 4
The Big 10, NCHC and CCHA conferences are located throughout the northern mid-west, with 7 programs in Michigan and 6 in Minnesota. Some of the newest programs to NCAA Division I include Lindenwood (Missouri), Stonehill (Massachusetts), Augustana (South Dakota), and Robert Morris (Pennsylvania), rejoining NCAA in 2023-2024.
Average attendance leaders, reported by USCHO.com, were largely out of the midwest, led by North Dakota with an average attendance of 11,399. Just 8 programs reporting attendance and capacity have capacity limits of less than 2000, with many older rinks on the east coast in the ECAC with Princeton (2100), Colgate (2222), and Union (2225) just over 2000.
Avg Attendance Leaders
University of North Dakota - 11,399
University of Minnesota - 9,156
University of Wisconsin - 7,855
University of Nebraska Omaha - 6,544
University of Denver - 6,295
Penn State University - 6,150
Capacity Leaders
Ohio State University
University of Wisconsin
University of North Dakota
University of Minnesota
University of Connecticut
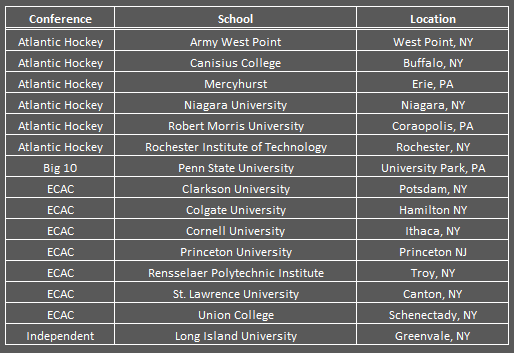
New England Schools

Tri-State Schools
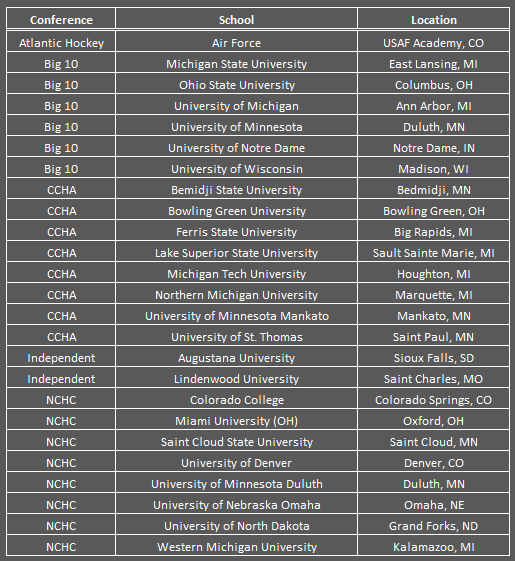
Midwest Schools
NCAA Division II
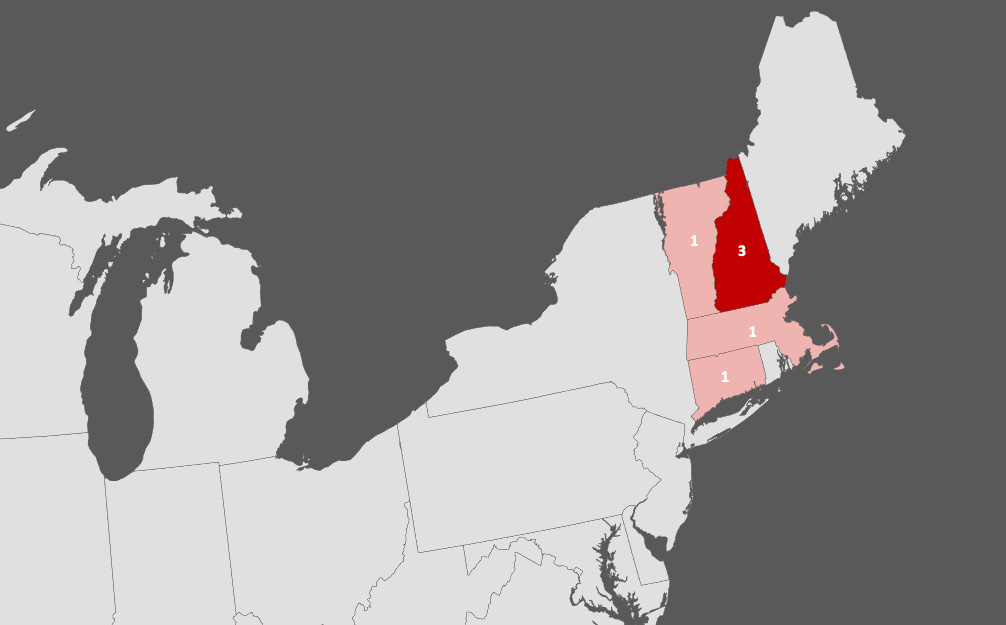
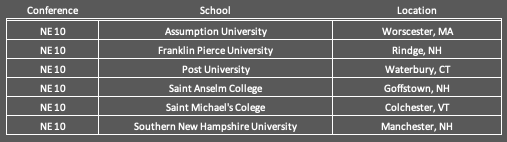
The Northeast 10 is the remaining “Division II” NCAA hockey, consisting of just 6 programs within New England, with half within the state of New Hampshire. Stonehill College , who recently moved up to Division I, was former champions of the NE10 in 2019-2020, and 2015-2016.
NCAA Division III
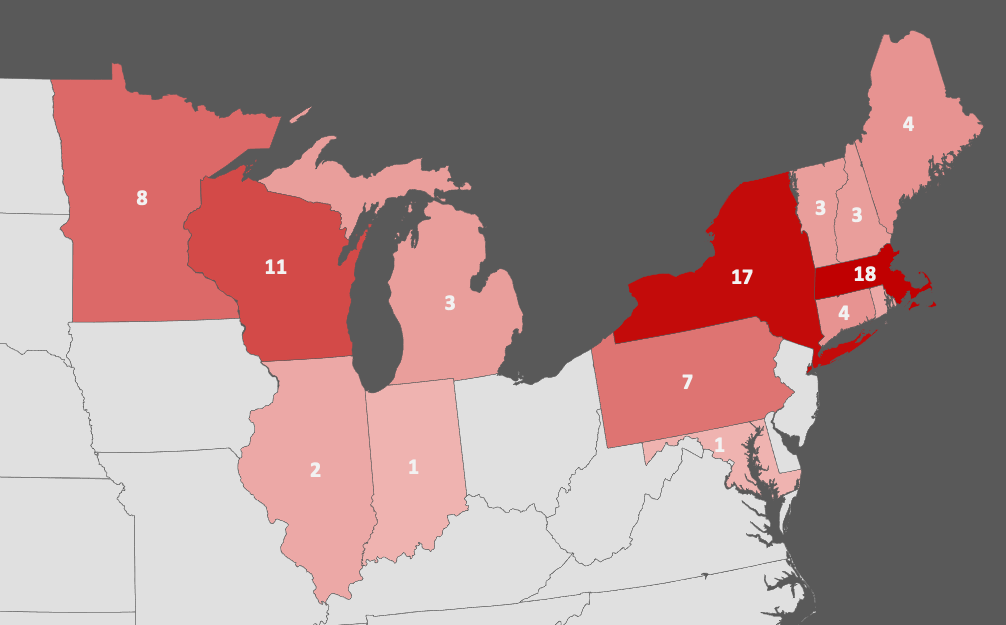
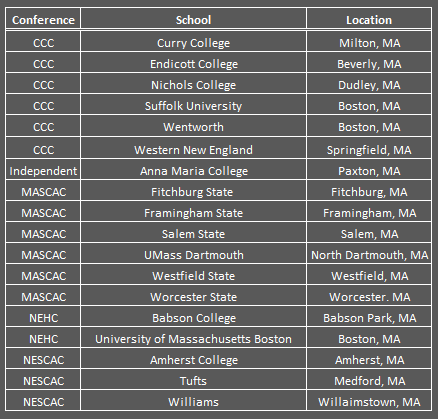
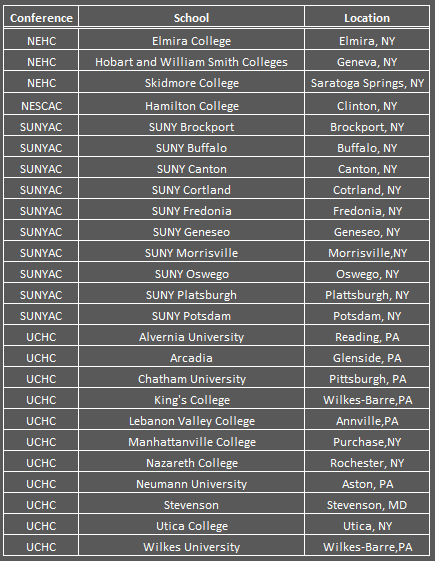
Division III hockey is a more concentrated, yet similar, coverage to Division I, with majority of programs remaining within New England, New York, and the upper mid-west. Massachusetts led all states with 18 total programs, the home of the MASCAC and majority of the CCC schools, with some NESCAC and NEHC programs as well. Similarly to Massachusetts, New York benefits from its own conference, the SUNYAC, which makes up 10 of 17 schools.
Most Programs By State
Massachusetts - 18
New York - 17
Wisconsin - 11
Minnesota - 8
Pennsylvania - 7
Both Minnesota (MIAC) and Wisconsin (WIAC), also have their own conferences, with the NCHA stretching across Wisconsin, Michigan, Illinois and Indiana.
When reviewing attendance for DIII, reported by USCHO.com, 4 of the top 5, and 7 of the top 10 highest avg attendance for 2022-2023 were in the Northeast or New York. Adrian, Plymouth State, Trine, Plattsburgh and Utica were leaders in capacity %, filing their barns to their fullest potential, with Utica College leading all schools in avg attendance with 2839. The average attendance of teams reporting for 2022-2023 was just 358,.
Avg Attendance Leaders
Utica College - 2,839
SUNY Oswego - 1,879
SUNY Plattsburgh - 1,478
Norwich University - 1,209
UW - Steven’s Point - 1,206
Capacity Leaders
Adrian College
Plymouth State
Trine University
SUNY Plattsburgh
Utica
UW - Eau Claire
UW - Stevens Point
Massachusetts Schools
New England Schools (Non Mass)

New York & Mid Atlantic
Midwest Schools


Included With Subscription
Year-round reporting from across North American Junior, Youth, Prep & College Hockey
Full access to catalogue of articles on the TSA Scouting Journal
Full access to all TSA Central scouting reports and Data Packs
USHL, NAHL Draft prospect reports and draft analysis
College spotlights and analysis
Information from our team of family advisors

Get your word out to thousands of monthly readers on the TSA Scouting Journal ! Contact us today at Info@Tri-StateAthletic.com with “Ad Info” in the subject !